 Catalogo de metadatos del IGME
Servicio web: WMS - Web Map Service
Type of resources
Available actions
Topics
Keywords
Contact for the resource
Provided by
Years
Formats
Representation types
Update frequencies
status
Service types
Scale
-
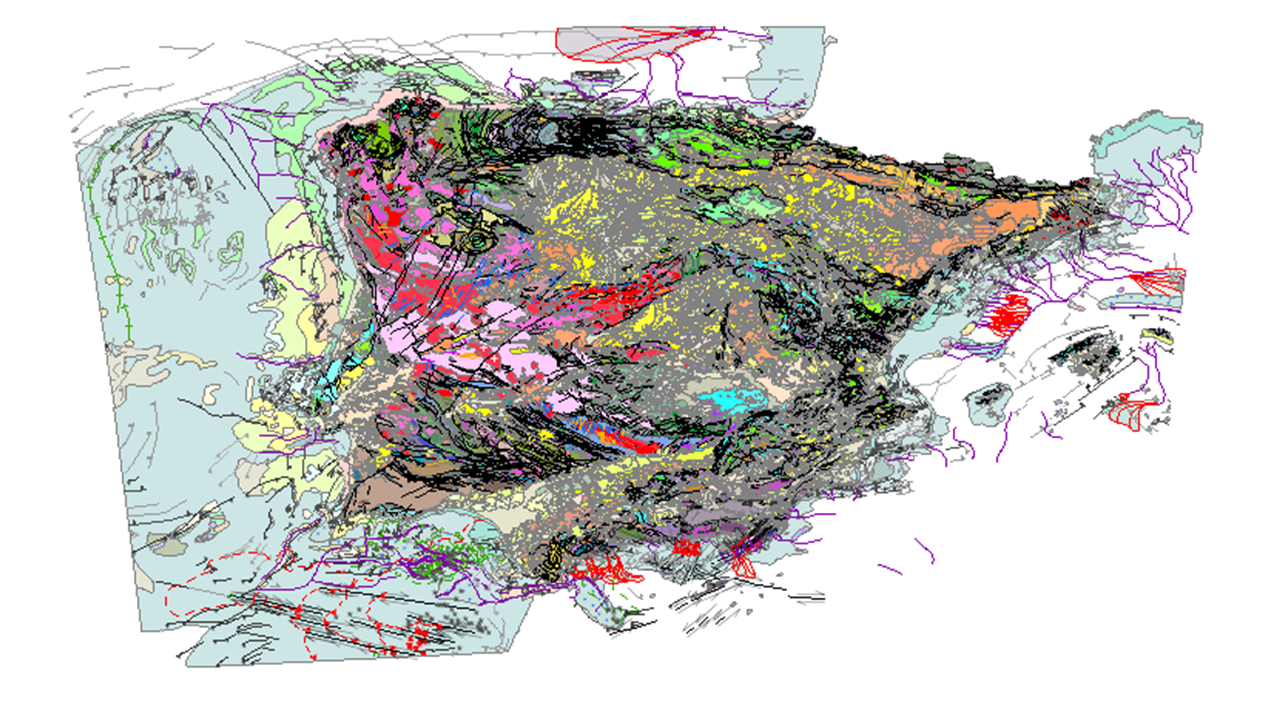
Geological map of Spain and Portugal at scale 1:1 000 000 of 2015 is an updated cartographic version of the Iberian Peninsula as well as Ceuta and Melilla and all the insular territory of Spain and Portugal: Balearic Islands, Canary Islands, Azores and Madeira, published periodically by the IGME in collaboration with the Geological Survey of Portugal (LNEG). This new version includes for the first time the geological cartography of the continental shelf and the Atlantic islands of Portugal. This map includes all the new geological knowledge that has resulted from the completion of the MAGNA series of 1:50,000 scale geological cartography of the IGME for the Spanish territory and the systematic series of cartography of the Portuguese territory developed by the LNEG. The continental part of the map has been composed from previous syntheses at a scale of 1:400,000 developed for each major geological unit in Spain, specifically, the Variscan Massif, the Pyrenees, the Baetic, Cantabrian and Iberian C. and the Cenozoic Basins of the Duero, Tagus and Ebro, and from the geological cartography at a scale of 1:200,000 produced in Portugal.
-
Visualisation service of the new Geological Map of Spain and Portugal at a scale of 1:1 000 000 published in 2015. This is the most updated version of the geological cartography of the Iberian Peninsula, as well as Ceuta and Melilla and the entire island territory of Spain and Portugal: Balearic Islands, Canary Islands, Azores and Madeira. This version includes for the first time the geological cartography of the continental shelf of both countries and of the Atlantic islands. This map includes all the geological knowledge provided by the MAGNA series of geological cartography at a scale of 1:50 0000 of the IGME, for the Spanish territory, and the systematic geological cartography of the Portuguese territory carried out by the LNEG. The continental part of the map is based on the previous 1:400,000 scale summaries prepared for each of the main geological units in Spain, namely the Variscan Massif, the Pyrenees, the Betic Cordillera, the Cantabrian and Iberian Cordillera and the basins of the Duero, Tagus and Ebro rivers, and the 1:200,000 scale geological mapping carried out in Portugal..
-
The Map of Geological Ages of the Iberian Peninsula, Balearic and Canary Islands at a scale of 1:1,000,000 is a map produced by the Geological Survey of Spain (IGME) based on the Geological Map of the Iberian Peninsula, Balearic and Canary Islands published in 1995. The cartographic units represented in it have been established by means of chronostratigraphic criteria, which have been specified down to the Series. The chronostratigraphic classification used was the "International Stratigraphic Chart" published in 2008 and drawn up by the International Commission on Stratigraphy of the International Union of Geological Sciences (IUGS). The igneous and metamorphic rocks have been assigned the corresponding chronostratigraphic section. The geological information for the Iberian Peninsula and the Balearic Islands is in UTM projection, zone 30, Postdam datum. The information on the Canary Islands is in UTM projection, zone 28, datum Pico de las Nieves. The map is distributed free of charge in shape format.
-
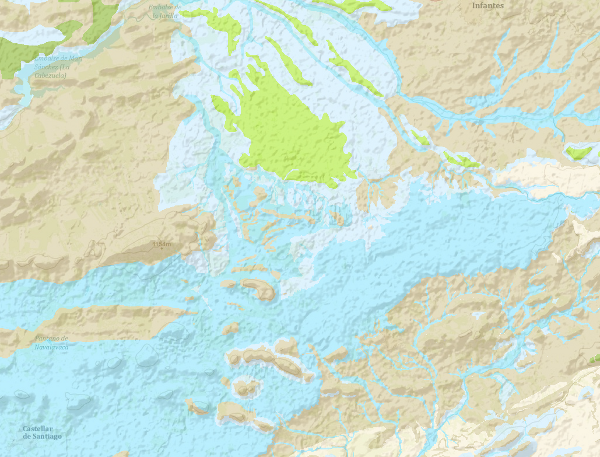
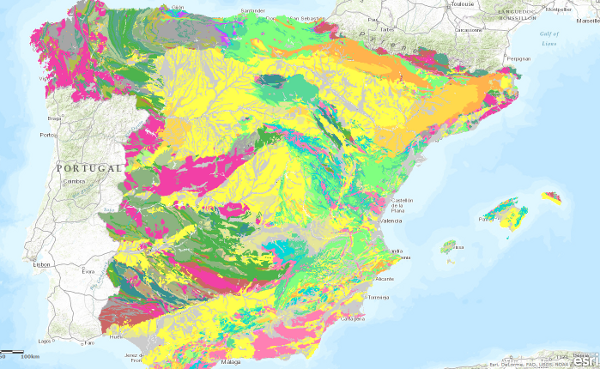
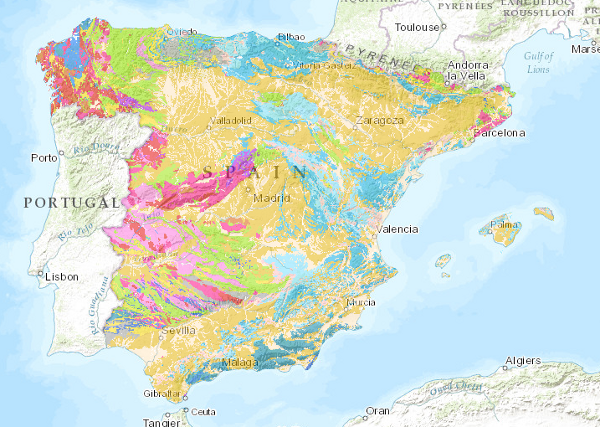
The continuous Hydrogeological Map of Spain in digital format at a scale of 1:200,000 is based on the Lithostratigraphic and Permeability Map of Spain, continuous at a scale of 1:200,000 and represents the mapped lithostratigraphic levels, grouped by range of permeability and the associated lithologies, and represented with a certain colour and tone, so that it is possible to visualise the areas associated with the different aquifers on the map. Blue colours represent porous aquifers, green colours represent fissured or karstic aquifers and brown colours represent impermeable or low permeability formations. Productivity is represented by the tone, in the case of permeable formations, dark tones indicate greater productivity and in the case of impermeable formations indicate greater impermeability. For the preparation of the Hydrogeological Map, once it had been verified that the formations that make up the main aquifers were cartographically differentiated on the Lithostratigraphic and Permeability Map of Spain, a hydrogeological legend was drawn up, grouping them according to their permeability, geometry, hydraulic relationship and hydrogeological functioning. This work was carried out taking into account the existing information on the different aquifers in Spain as well as the groundwater bodies defined in accordance with the Water Framework Directive (WFD). The continuous Hydrogeological Map of Spain in digital format at a scale of 1:200,000,000 arises from the need for a continuous map of the entire national territory on which to capture the information and distribution of the groundwater bodies (m.a.s). This cartography is adapted to the hydrographic network and the shadow model made by CEDEX, at a scale of 1:20,000, from the topographic base, at a scale of 1:50,000, of the Army Cartographic Service. The cartographic information is referenced to coordinates in UTM projection, European Datum, zone 30, except for the Canary Islands, which is referenced to zone 28. The Hydrogeological Map is made up of a polygonal layer of cartographic units (LPLIT) and the external tables Hidro.dat and Descrip_hidro.dat. The format of the information generated is Shape file.
-
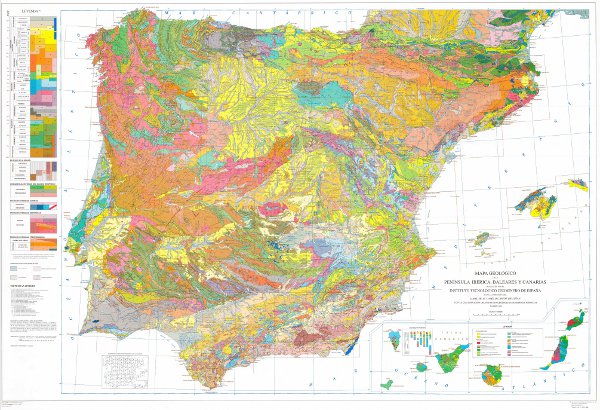
The Geological Map of the Iberian Peninsula, Balearic and Canary Islands or Geological Map of Spain at a scale of 1:1,000,000 is a map developed by the Geological Survey of Spain (IGME) on a cyclical basis since its foundation, being the 1995 version the first to be digitised. This map is an infrastructure of homogeneous and global geological knowledge of a geological unit of continental scale such as the Iberian Peninsula. The map contains the chronolithostratigraphic units with representation of the tectonic structure by means of faults and thrusts. It is also accompanied by two chronolithostratigraphic legends (Peninsula and Balearic and Canary Islands) and the conventional signs. Each of the geological units has an associated description, the dominant rock types and the chronostratigraphic age with precision down to the Flo, when available. There is no difference between the contacts of the map units, all of them being considered as lithological contacts, with the exception of those that are the product of faults. The map is consistent with a topographic base at a scale of 1:1,000,000 prior to the BCN 1000 of the IGN, which is only available in paper format. The geological information on the Iberian Peninsula and the Balearic Islands is in UTM projection, zone 30, Postdam datum. The information on the Canary Islands is in UTM projection, zone 28, datum Pico de las Nieves. The map is distributed free of charge in shape format through the IGME website.
-
The Lithological Map of the Iberian Peninsula, Balearic and Canary Islands at a scale of 1:1,000,000 is a map produced by the Geological Survey of Spain (IGME) based on the Geological Map of the Iberian Peninsula, Balearic and Canary Islands published in 1995. The cartographic units represented in it have been established using lithological criteria, with the lithological association defining the limits of each unit. The geological information on the Iberian Peninsula and the Balearic Islands is in UTM projection, zone 30, Postdam datum. The information for the Canary Islands is in UTM projection, zone 28, datum Pico de las Nieves. The map is distributed free of charge in shape format through the IGME website.
-
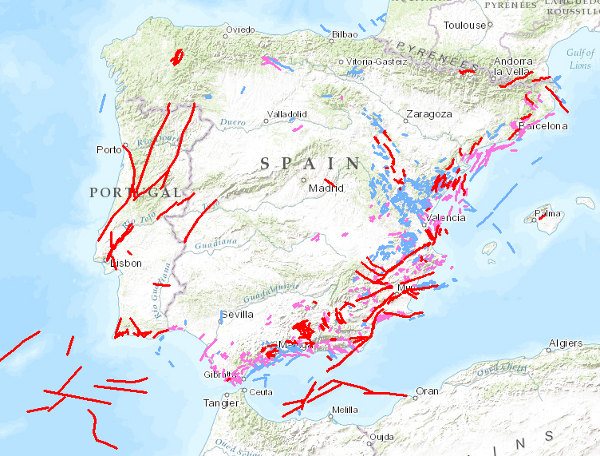
QAFI is a database of faults with geological evidence of proven activity during the Quaternary period (the last 2.6 million years according to the limit officially established by the SQS in 2009) of the Iberian Peninsula. It is a project in constant revision and updating as a result of the progress of studies and knowledge about the structures capable of generating earthquakes in Iberia, and can never be considered complete or definitive, both because of the scientific nature of the data contained in it, and because of the modus operandi used in its construction: the altruistic collaboration of numerous researchers in Earth Sciences. QAFI, both in Access format and geospatially represented, is hosted and maintained by the Geological Survey of Spain (IGME), and is accessible to the entire scientific and technical community and society in general.
-
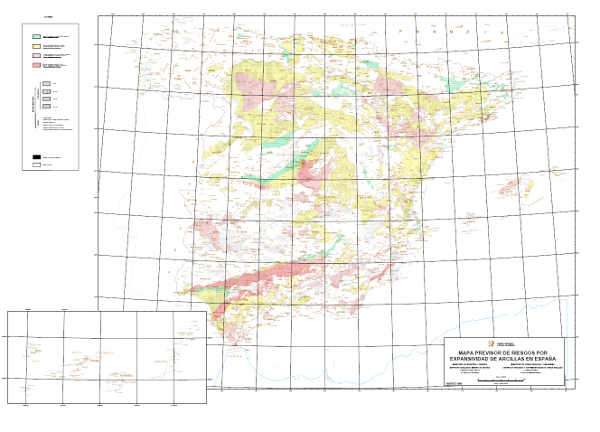
The Predictive Map of Expansivity Risks of Spanish Clays at a scale of 1:1,000. 000 delimits the clay formations, classifying them into 4 grades according to their expansivity potential: Non-expansive clays or clays dispersed in a non-clay matrix: No or low risk of expansivity; Subordinate expansive clays or clays located in climatic zones without an annual humidity deficit: Low to moderate expansivity risk; Locally predominant expansive clays located in climatic zones with annual moisture deficit: Moderate to high expansivity risk; Predominant expansive clays in areas where expansivity problems have occurred. High to very high expansivity risk. The term expansivity defines the capacity of the soil to undergo volume changes when its moisture conditions are modified, or to generate pressures if expansion is prevented. This map was made by the Geological Survey of Spain (IGME) with the collaboration of the Centro de Estudios y Experimentación de Obras Públicas (CEDEX) in 1986.
-
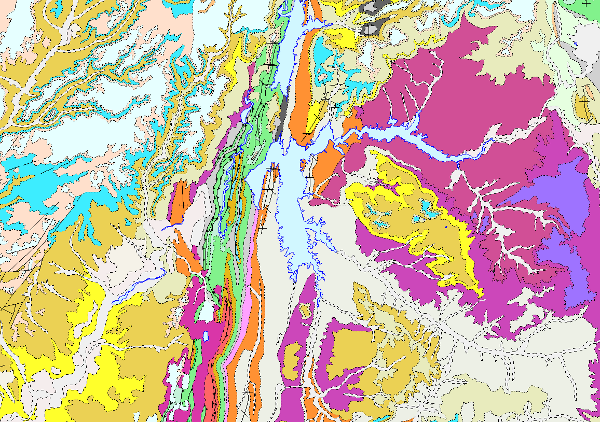
The continuous lithostratigraphic map of Spain in digital format at a scale of 1:200,000 represents the cartographic units characterised mainly according to lithostratigraphic and hydrogeological criteria. The criteria maintained to consider their cartographic representation are to maintain those units that present an important lithostratigraphic development, both for their representation and their singularity, also incorporating those that show a high hydrogeological interest, either because of their lithological nature (high permeability) or because they are considered to form an essential part of the definition of the aquifer. The contacts between the cartographic units represented were normal, unconformable and intrusive contacts. Faults, thrusts and folding structures are represented. Thus, a continuous map has been obtained in digital format, in which there are still areas with a higher density of cartographic information than others, either because they come from synthesis maps made with less general criteria than these, or because for their preparation, smaller scale cartographies (e.g. 1:50,000) have been used, thus obtaining a much richer and more detailed cartography. This map is the basis of the permeability and hydrogeological maps of Spain at a scale of 1:200,000 continuous and in digital format. This cartography is adapted to the hydrographic network and the shadow model made by CEDEX, at a scale of 1:200,000, from the topographic base, at a scale of 1:50,000, of the Army Cartographic Service. The cartographic information is referenced to coordinates in UTM projection, European Datum, zone 30, except for that corresponding to the Canary Islands, which is referenced to zone 28. The map is made up of the following information layers: Cartographic Units (LPLIT), Contacts and Fractures (LPCYF) and Folding Structures (LPEST). The format of the information generated is Shape file.
-
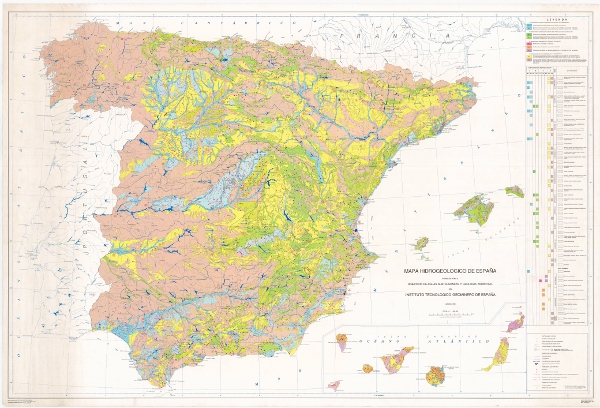
The Hydrogeological Map of Spain at a scale of 1:1,000,000 presents the geological units classified according to their hydrogeological character, based on the surface permeability of the outcrops. The hydrogeology is represented by symbolisation of the materials. It is a synthesis of the permeable hydrogeological formations and aquifers at national level, resulting from the systematic studies carried out by the IGME until 1991 on the hydrogeological characteristics of the territory of Spain, determining the location of the aquifers, evaluating their degree of exploitation, hydrodynamic characteristics, resources and reserves, and the quality and contamination of their waters. The map has been drawn up by the Geological and Mining Institute of Spain in compliance with its specific functions. It covers the national territory of the Iberian Peninsula, the Balearic Islands and the Canary Islands. The first edition of the Hydrogeological Map of Spain at a scale of 1:1,000,000 corresponds to 1991. A second edition was produced in 1999, incorporating the Hydrogeological Units of Spain into the hydrogeological map.